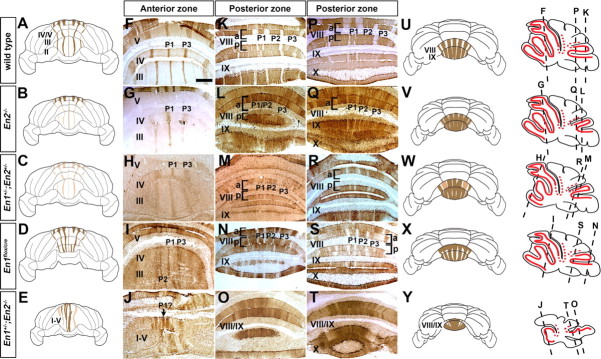
Figure 5.
ZebrinII molecular coding is sensitive to the dosage of En1/2. A–E, U–Y, Schematics illustrating the ZebrinII pattern in the anterior (A–E) and posterior (U–Y) lobules. The schematics show the general trends in morphological and molecular coding defects. F–T, ZebrinII molecular coding is altered in a dose dependent manner as seen on coronal cut tissue sections. In the AZ (F–J), the phenotypes range from weak lateral stripes (En2−/−), to all weak stripes (En1+/−;En2+/−), to extra stripes (En1flox/cre), and finally to a complete disorganization of stripes (En1+/−;En2−/−). The arrow in J points to a stripe with possible homology to the wild-type P1+ stripe (indicated as P1? due to its obscure identity in mutants with severe phenotypes). Similarly, in the PZ (K–T) of the mutants, the pattern of ZebrinII is progressively altered by En mutations. Tissue sections in K–O were taken from more caudal regions than those in P–T. The sagittal schematics on the right indicate the level of the coronal tissue sections. Solid red lines indicate ZebrinII stripe expression, whereas dotted red lines indicate “transition zones.” Scale bar (in F), 500 μm (applies to F–T).

