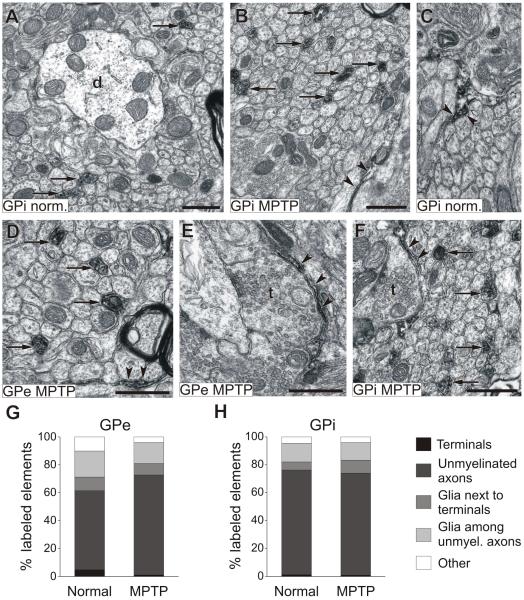
Fig. 2. GAT-1 labeling in GPe and GPi of normal and MPTP-treated monkeys.
A to F show examples of GAT-1-labeled elements, arrows point to labeled unmyelinated axons, while arrowheads indicate glial processes. G-H display proportions of labeled elements in either pallidal segment in normal and MPTP-treated animals. Abbreviations: d, dendrites; t, terminals. All scale bars are 0.5 μm. The scale bar in F is valid for C.

