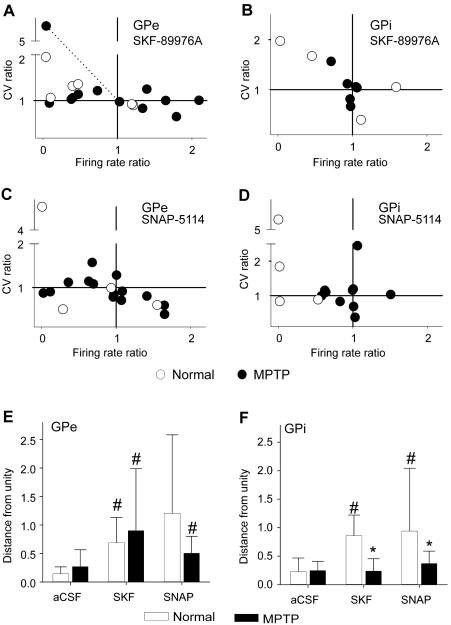
Fig. 6. MPTP-induced changes in the effects of GAT blockers on the activity of pallidal neurons.
Shown are ratios of changes in firing rates and coefficients of variation (CV) in response to GAT-1 (SKF-89976A) and GAT-3 (SNAP-5114) blockers. The two bottom panels show means ± SD of distances from each data point to the data point at which the CV ratio and firing rate ratio was 1. An example of how these distances were calculated is represented by the dotted line in the first panel. #, Different from the respective aCSF at p 0.05; and *, different from the normal state at p < 0.05.

