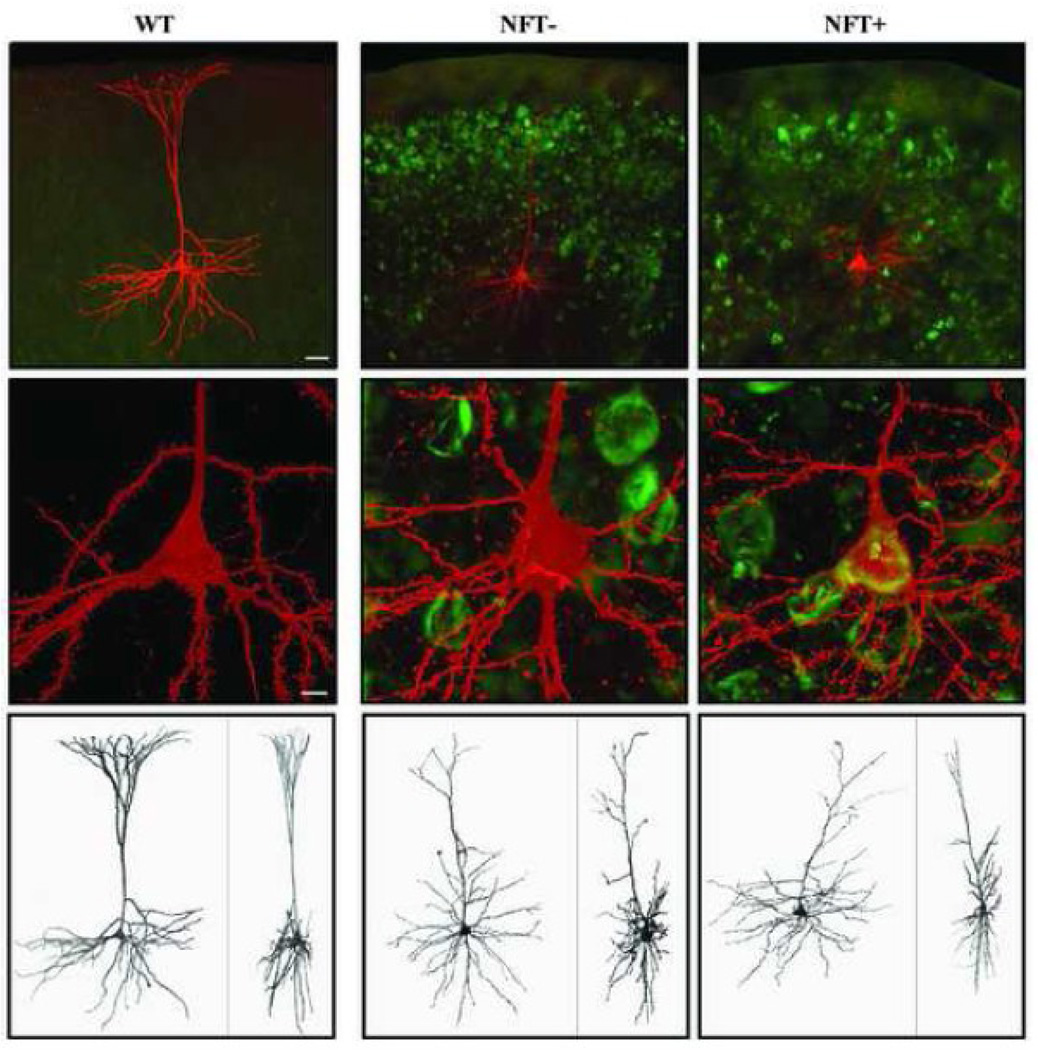
Figure 1. Confocal images of representative streptavidin-Alexa 546-labeled layer 3 pyramidal cells from WT (left) and TG (center and right) mice.
Top row: 10× confocal images of the cells with Thioflavin-S staining showing a high density of NFTs in the cortex of TG mice. Middle row: Somata of cells shown in top row at 40×. Imaging the Thioflavin-S staining in the soma allows for the classification of the TG cells into one of 2 groups based on the presence or absence of a NFT, respectively named NFT− cells (center column) and NFT+ cells (right column). Bottom row: 3-D reconstruction of cells imaged at high resolution (xy and xz projections on the left and right side of each panel, respectively). Scale bars: top row = 40 µm; middle row = 5 µm.

