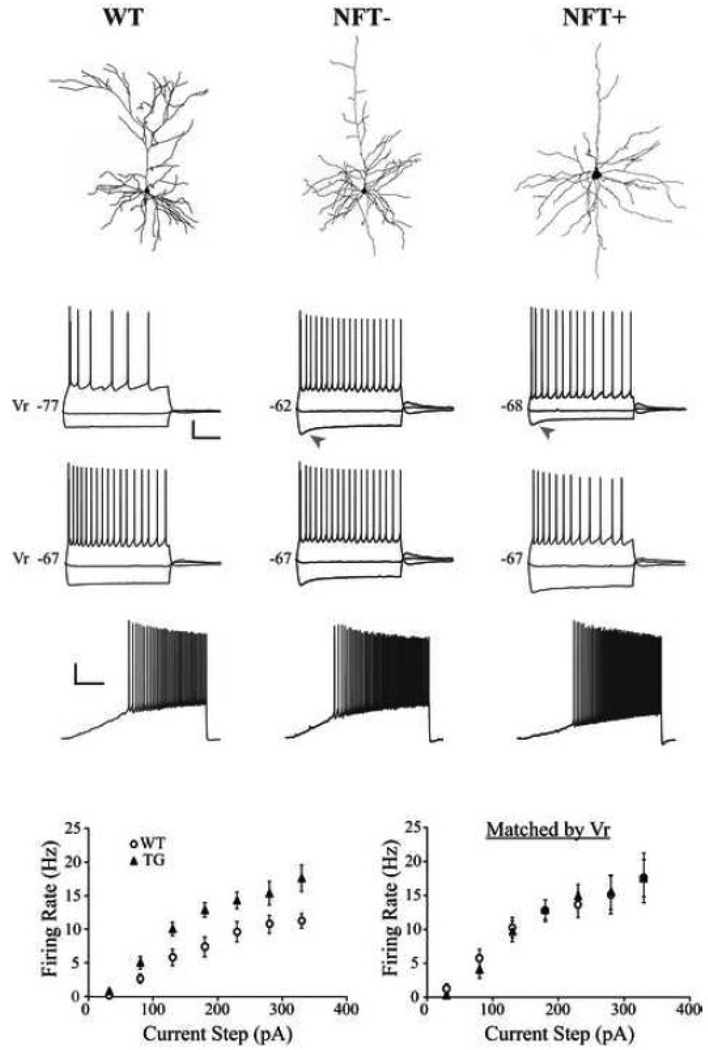
Figure 2. Membrane voltage responses to injected current from representative WT, NFT− and NFT+ cells.
A) Top: Cells from which recordings shown in panels A1 and 3 were obtained. Panels 1–3: Membrane voltage responses evoked by 2 s current steps in cells with different Vr (1), and in cells matched by Vr (2), or by a 10 s depolarizing current ramp from 0 to 200 pA (3). WT cells fired at a lower frequency than either NFT− or NFT+ cells while the latter two groups did not differ (1). Arrowheads indicate a pronounced “sag” in TG (but not WT) cells. None of the groups differed significantly in firing frequency when matched by Vr (2). Scale bars: 1 and 2 = 20 mV, 500 ms; 3 = 20 mV, 2 s. B) Mean frequency-current plots for all WT and TG cells (left, p < 0.05 at each current step) and for subgroups of WT and TG cells that are matched by Vr (right).

