
Figure 2.
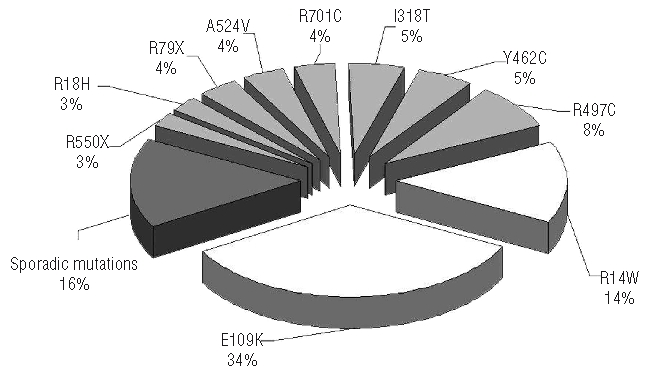
Allelic distribution of SEC23B mutations. This pie chart shows the incidence of the most frequent mutations (white), the less frequent mutations (light gray) and mutations found in one kindred only (dark gray). These last include the following mutations: three nonsense (R217X, R264X, R401X), two frameshift (D355IfsX8, T654TfsX13), one splicing (c.689+1 G>A), and six missense (Q386R, R503Q, R530Q, Y562C, F656L, K723Q).