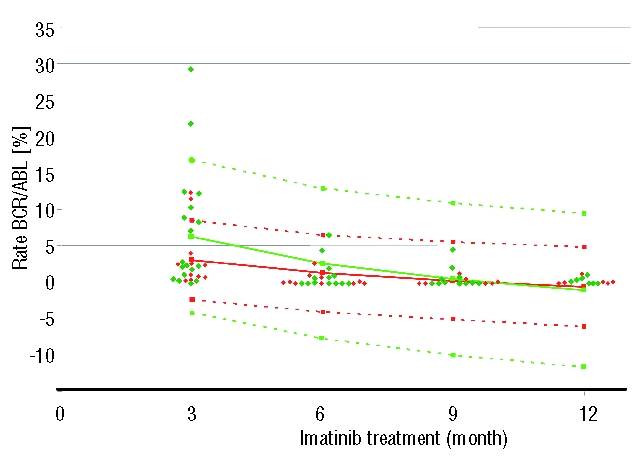
Figure 1.

Time course of the transcript ratio BCR-ABL/ABL in individual patients exhibiting either the e13a2 rearrangement type (red dots) or the e14a2 type (green dots) in pediatric patients with chronic myeloid leukemia under ongoing imatinib treatment. Full lines denote the best fitted curves adapted by logarithmic function for decline over time while dotted lines show the upper and lower limits of confidence (red lines: e13a2; green lines e14a2).
