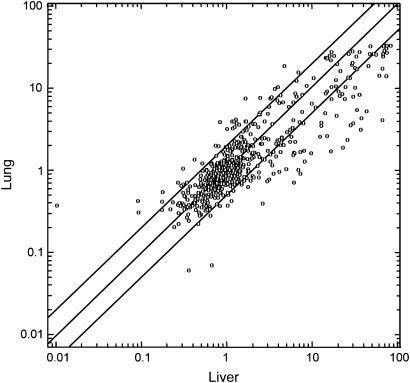
Fig. 1.
Scatter plot relating the expression of 576 miRNAs in the liver (x-axis) and in the lung (y-axis) of sham-exposed male mice. The scales indicate the normalized miRNA expression intensity. The central diagonal line indicates equivalence in the intensity of miRNA expression in liver and lung. The outer diagonal lines indicate 2-fold differences in miRNA expression between the two organs. The circles falling in the upper left area refer to miRNAs whose expression was >2-fold higher in lung as compared with liver, whereas the circles falling in the bottom right area refer to miRNAs whose expression was >2-fold higher in liver as compared with lung.

