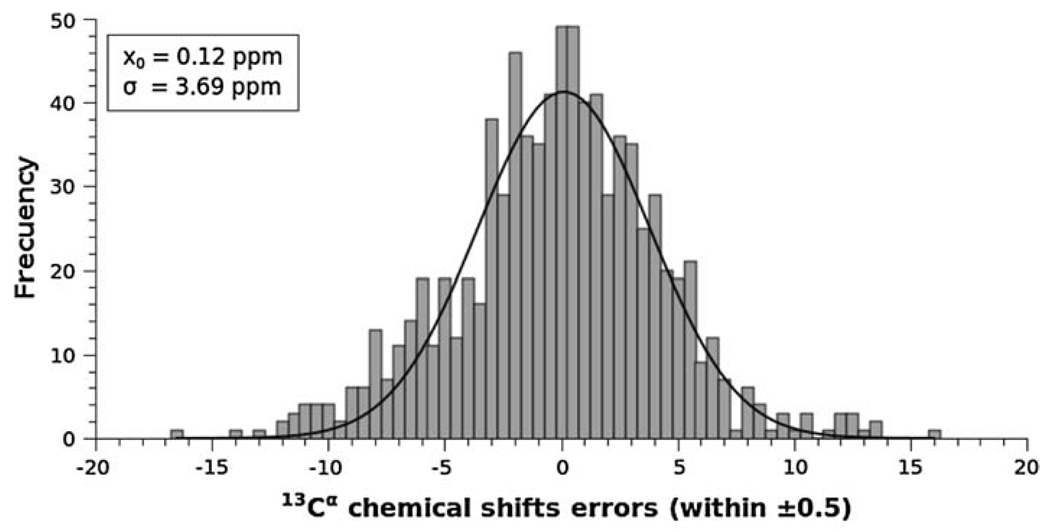
Fig. 2.
Frequency of the error, , between computed and observed 13Cα chemical shifts, for each of the 801 cysteine residues in cystines computed in this work, i.e., from all proteins listed in Table 1, except BPTI. The data were binned using an interval of 0.5 ppm, and then fit to a Gaussian function with a mean value x0 = 0.12 ppm, and standard deviation σ = 3.69 ppm

