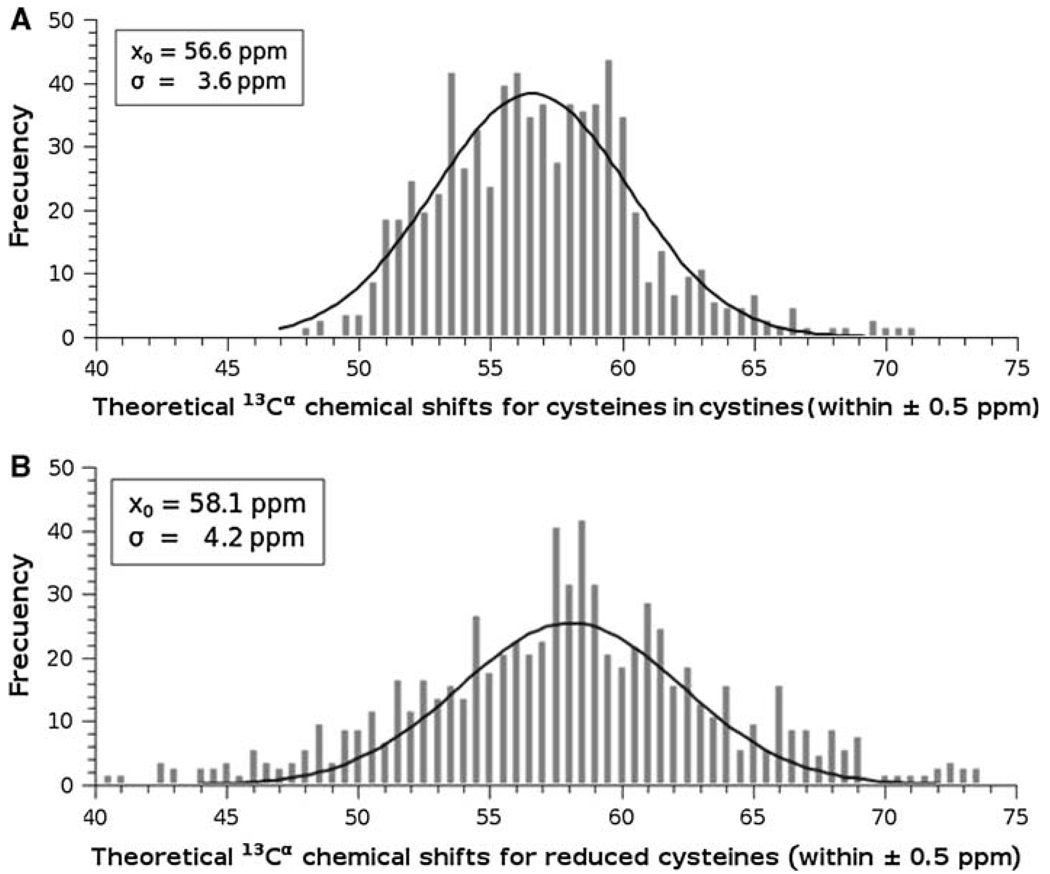
Fig. 3.
Frequency of the computed 13Cα chemical shifts for all 837 cysteines in cystine: A for cysteines in cystine. The data were binned using an interval of 0.5 ppm, and then fitted to a Gaussian function with a mean value x0 = 56.6 ppm, and standard deviation of σ = 3.6 ppm; B same as A for reduced cysteines; with x0 = 58.1 ppm, and standard deviation of σ = 4.2 ppm

