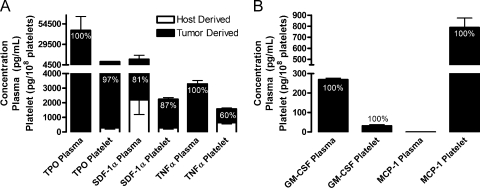
Figure 2.
Predominantly tumor contributions to cytokine concentrations in plasma and platelet releasate. (A and B) Plasma and releasates from platelets activated with 500 µM PAR-4 and 100 nM PMA (Platelets) were isolated from mice injected subcutaneously with human LNCaP-C4-2 cells. Species-specific protein arrays were used to determine the concentrations of murine (Host Derived, white columns) and human (Tumor Derived, black columns) cytokines and growth factors. Concentrations are represented as mean values ± SEM. Percentages represent the tumor contribution to the total concentration of each protein in plasma or platelets.

