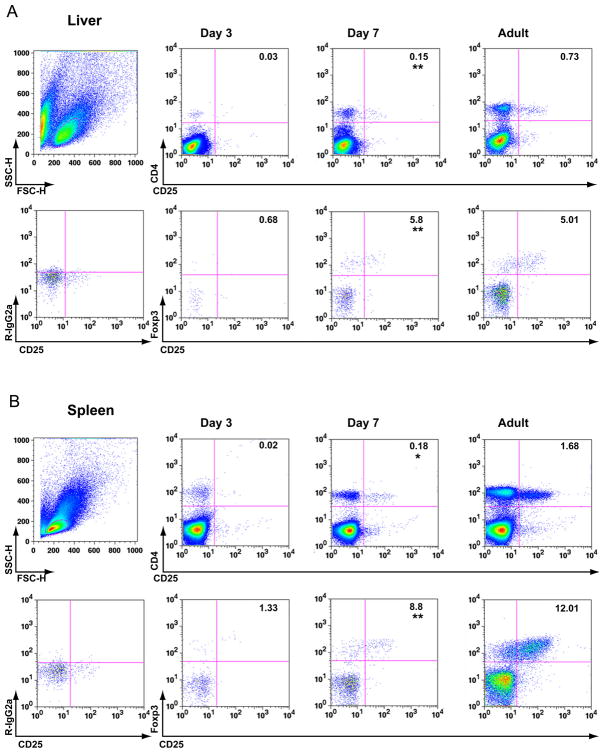
Figure 2. Population of liver and lymphoid tissue with Tregs during ontogeny of BALB/c mice.
Flow cytometric quantification of Foxp3+ CD4+ CD25+ Tregs in MNCs from the liver (A) and spleen (B) of neonatal (3- and 7-day-old) and adult (3-month-old) mice. In both panels, Top row: boxed dot plots depict size-gated total lymphocytes (left column) stained for the Treg surface markers CD4 and CD25. Bottom row: Dot plots depict CD4+ lymphocytes expressing CD25 and the Treg transcription factor Foxp3. Stains with isotype control antibodies were used as negative controls (left column). Numbers in both panels represent the average percentage of gated total lymphocytes (top row) or of gated total CD4+ cells (bottom row). Statistical differences between means for groups of 3- and 7-day-old mice are marked with ** (p≤0.005), * (p≤0.01), N=3 mice per group and time point.

