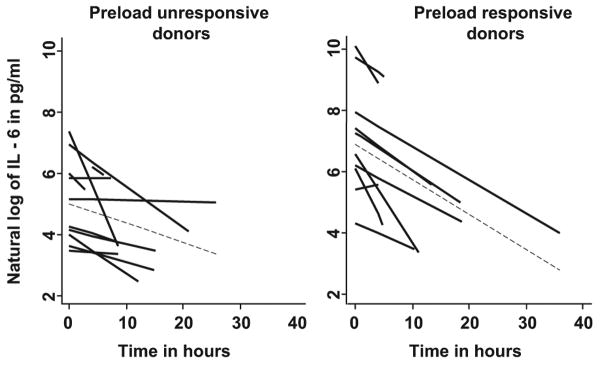
Figure 2.
Spaghetti plots illustrating interleukin (IL)-6 concentrations over time in individual donors. Preload responsive donors had higher log IL-6 concentrations at baseline compared with preload unresponsive donors. Time in hours represents the cytokine levels drawn after study enrollment. Log indicates the natural logarithm of individual IL-6 levels. Dashed lines indicate the mean slope of decline in IL-6 concentrations among all donors over time in the two groups.

