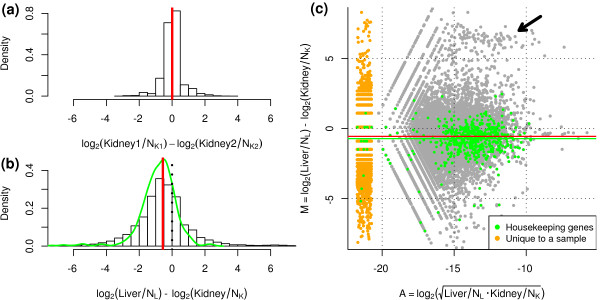
Figure 1.
Normalization is required for RNA-seq data. Data from [6] comparing log ratios of (a) technical replicates and (b) liver versus kidney expression levels, after adjusting for the total number of reads in each sample. The green line shows the smoothed distribution of log-fold-changes of the housekeeping genes. (c) An M versus A plot comparing liver and kidney shows a clear offset from zero. Green points indicate 545 housekeeping genes, while the green line signifies the median log-ratio of the housekeeping genes. The red line shows the estimated TMM normalization factor. The smear of orange points highlights the genes that were observed in only one of the liver or kidney tissues. The black arrow highlights the set of prominent genes that are largely attributable for the overall bias in log-fold-changes.

