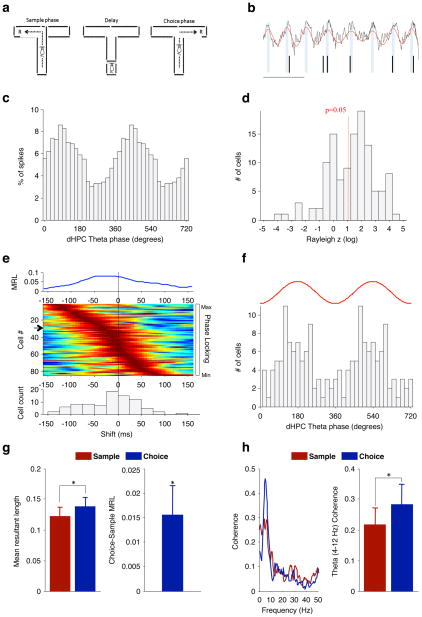
Figure 1. Hippocampal–prefrontal synchrony during a spatial working memory task in mice.
a, Spatial working memory task (see text). R, reward. b, Example field potential recording from the hippocampus (black trace) showing theta oscillations (red trace) and spikes recorded simultaneously from a prefrontal neuron (tick marks). Scale bar, 200 ms. c, Distribution of hippocampal theta phases at which the neuron in b fired. d, Distribution of Rayleigh z scores, for estimating significance of phase-locking to hippocampal theta oscillations, for prefrontal neurons recorded from wild-type mice. The red line denotes the significance threshold (P < 0.05); 83 of 125 neurons were significantly phase-locked. e, Prefrontal neurons phase-lock most strongly to the theta phase of the past. Top: strength of phase-locking of a single prefrontal neuron as a function of lag between the prefrontal spike and the hippocampal field potential recording. MRL, mean resultant length (Methods). Middle: normalized phase-locking strength of each neuron as a function of lag. Rows represent individual neurons ordered by the lag of maximal phase-locking. Arrow, neuron corresponding to trace at top. Bottom: distribution of lags at which each cell was maximally phase-locked (lag, −17.5 ± 6.2 ms (mean ± s.e.m.); P = 0.016; Wilcoxon signed-rank test). f, Distribution of hippocampal theta phases to which prefrontal neurons are significantly phase-locked (mean ± 95% confidence interval, 166° ± 43.8°; P = 0.0005, Rayleigh test). The red trace is a schematic of a single theta cycle. g, Phase-locking strength in the centre arm of the maze during sample and choice phases (left) and the difference in phase-locking across the two conditions (right). h, Coherence between hippocampal and prefrontal field potentials during the same task phases as in g: an example of coherence in one session (left); theta coherence (4–12 Hz) across animals (right). *P < 0.05; data shown, mean ± s.e.m.

