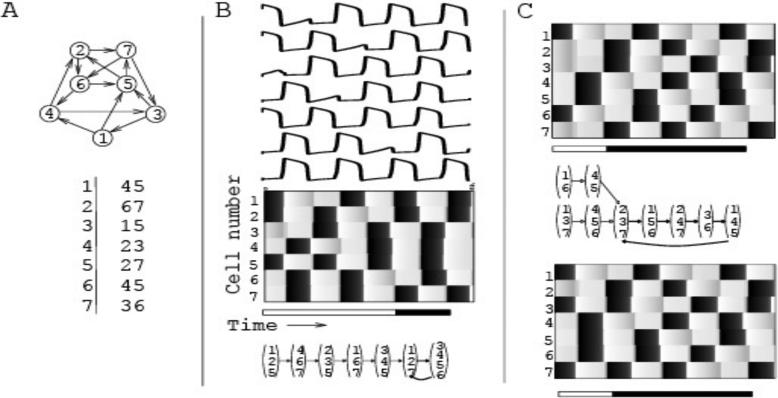
Figure 1.
An example of Model I. (A) The network consists of 7 cells with connections indicated by arrows. The connectivity is summarized in a table (bottom), in which the left column shows the indices of all cells, and the remaining columns show the indices of all cells that receive connections from the cell on the left. B) An example of network activity. The top panel shows the time courses of voltage in all 7 cells over 8 epochs of activity. Grey scale in the checkerboard panels corresponds to the magnitude of voltage, with black areas indicating spikes. After a transient (white part of the time bar under the checkerboard) the response converges to a repeating pattern (black part of the time bar). The bottom panel shows the orbit of the discrete dynamical system corresponding to this example. (C) Solutions of the same network, but with different initial conditions. These solutions have different transients (white parts of the time bars), but they converge to the same attractor (which, in turn, is different from the one in B).

