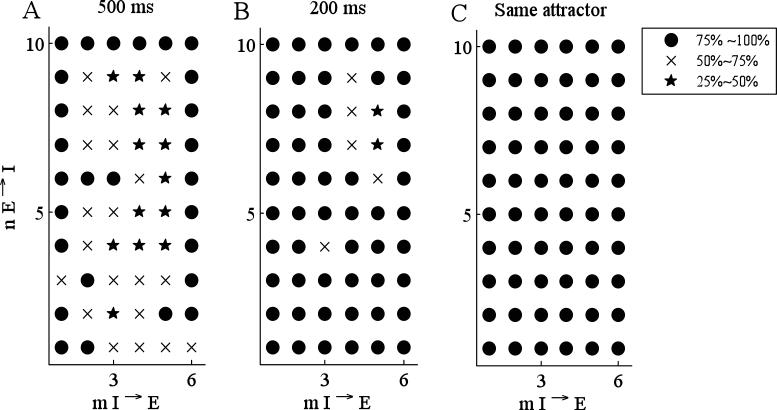
Figure 7.
Comparison between the continuous and the discrete models in a network of 10 E- and 6 I-cells. For each grid point at position (m,n), 20 networks are randomly chosen in which every I-cell receives connections from n E-cells and every E-cell receives connections from m I-cells. For each such network, 5 different initial conditions are chosen at random. The marker type corresponds to the percentage of simulations in which the continuous and the discrete models had the same firing patterns for A) 500 ms and B) 200 ms. In C), the marker type corresponds to the percentage of simulations in which the continuous and the discrete model reach the same attractor, regardless of the transient. Values of parameters are listed in Tables 1 and 2.

