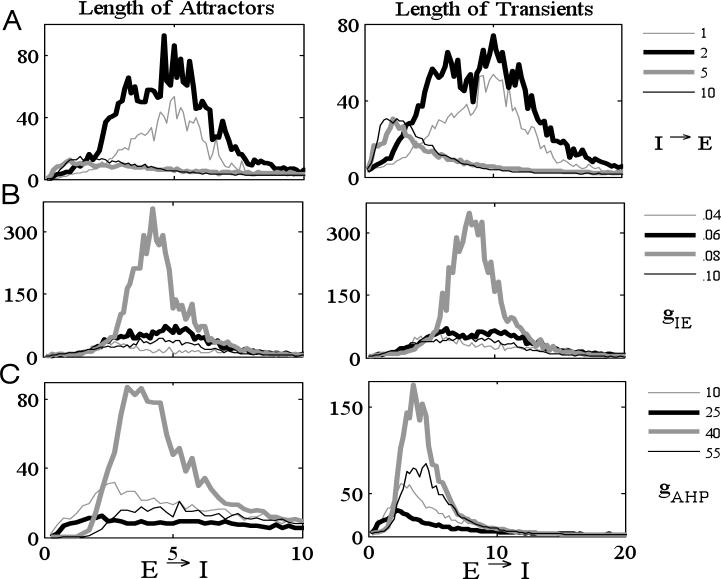
Figure 9.
Numerical simulations of the discrete model (100 E-cells and 40 I-cells). At each number of incoming connections, we considered 100 different random networks with 20 different initial conditions and then took the average length of attractor and transient. Each curve is plotted against the average number of E → I connections per cell. (A) Dependence of the lengths of attractors (left) and transients (right) on number of connections. Each curve represents a fixed number of I → E connections. (B,C) Dependence of lengths of attractors and transients on parameters gIE (B) and gAHP (C). Here we fixed the number of I → E connections (2 I → E in (B) and 5 I → E in (C)). Same parameter values as in Tables 1 and 2.

