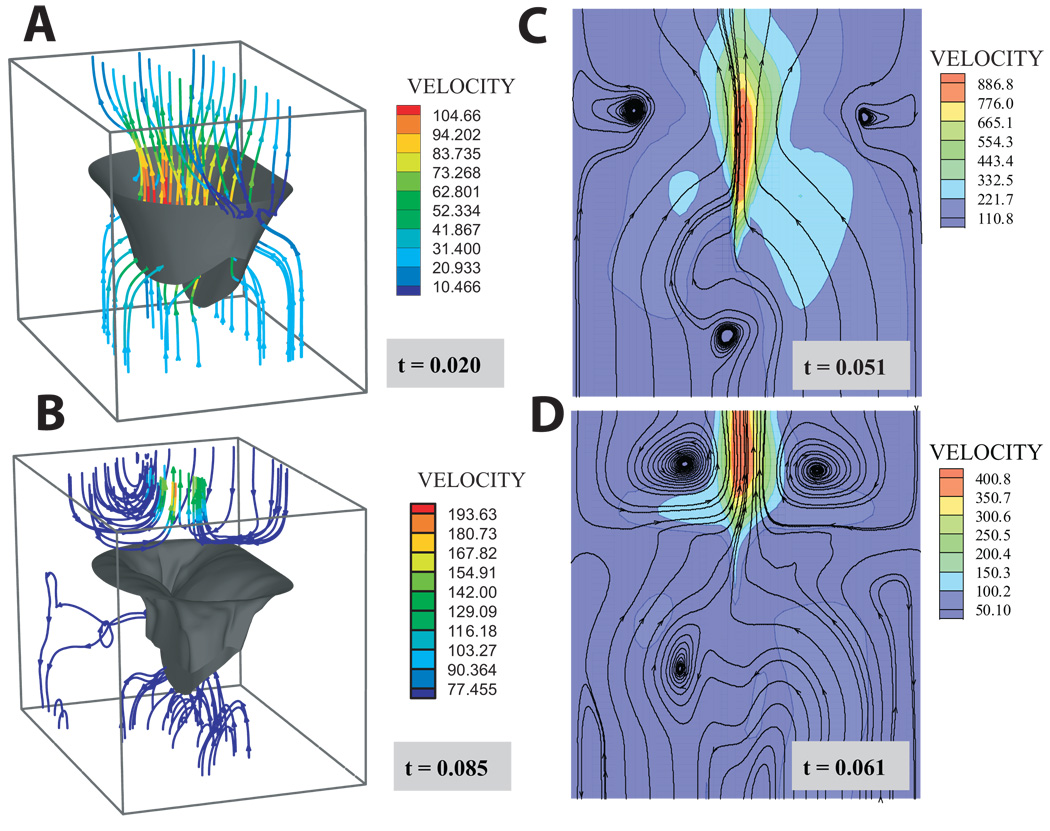
Figure 2.
Streamlines at four time points during the simulation: A) the beginning of the simulation before diastolic flow has reversed; B) the end of the simulation after coaptation and as the atrial flow begins to settle; C & D the moments preceding and immediately following coaptation, respectively. Note: chordae have been omitted from the figure for clarity. Panels C & D are cross-sections at the symmetrical midline shown in Figure 1.

