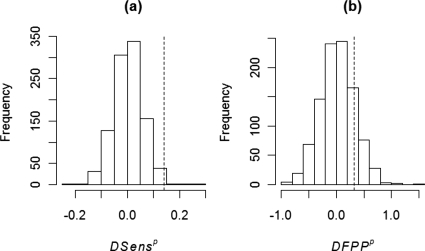
Figure 1.
Distribution of test statistics for (a) differences of sensitivity (ΔSensp) and (b) differences of average false positives per patient (ΔFPPp) between reader panel and CAD readings for LIDC data set. Distributions were calculated under null hypothesis of no difference between reading methods using a randomization test (with 1000 replications). The value of the observed test statistic is indicated by a dotted vertical line.

