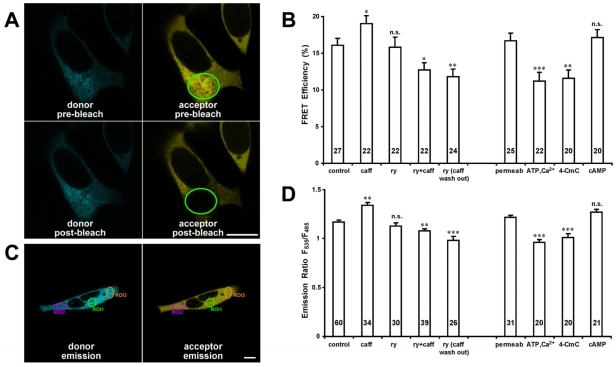
Fig. 3.
FRET analysis of HEK293 cells expressing RyR2S437-YFP/S2367-CFP. (A) Confocal images showing cyan and yellow fluorescence before and after photobleaching from a HEK293 cell expressing RyR2S437-YFP/S2367-CFP cDNA. The green ellipse demarcates the area selected for photobleaching. Scale bar: 10 μm. (B) Changes of averaged FRET efficiency of the RyR2S437-YFP/S2367-CFP upon treatment with various RyR2 channel modulators. *P<0.05, **P<0.01 and ***P<0.001, respectively, compared with control. (C) Confocal images of CFP and YFP fluorescence were acquired under CFP excitation only (458 nm). The emitted fluorescence intensities were measured at 485±15 nm (CFP) and 535±15 nm (YFP). At least three regions of interest (ROI) were selected within each HEK293 cell, and the fluorescence intensities of each ROI were analyzed by LAS AF, and mean intensities were used to calculate the emission ratio F535/F485. Scale bar: 10 μm. (D) Changes in averaged emission ratio upon treatment with RyR2 modulators. Data are mean ± s.e.m., with the number of cells indicated on the bars.

