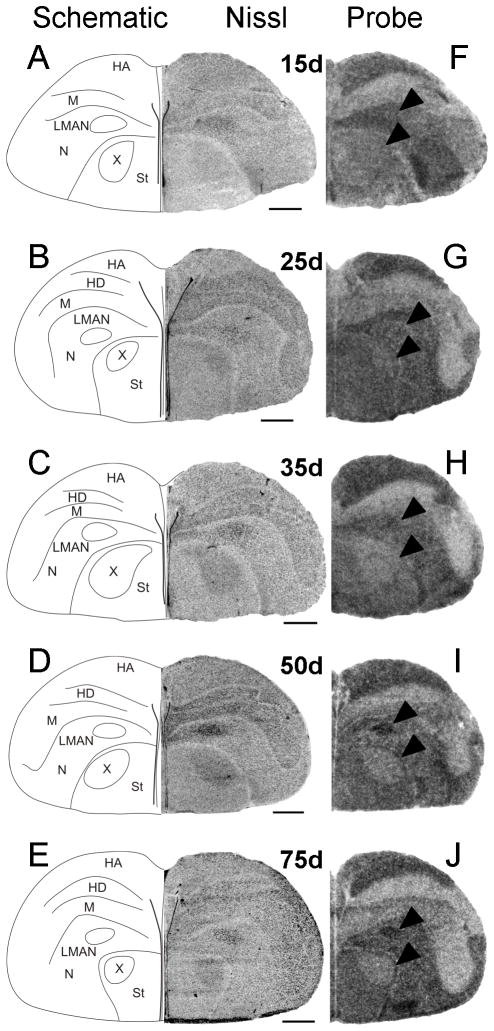
Fig. 6.
Developmental pattern of Cntnap2 expression in hemicoronal sections of male anterior forebrain. Prior to 50d, Cntnap2 signals in LMAN (F,G,H) were similar to those in the surrounding N. From 50–75d, Cntnap2 signals in LMAN were higher than those in the robustly labeled region of N. Transcript levels in area X of developing males were lower than in the surrounding St. This contrast was particularly evident at 50 (I) and 75d (J). Robust expression was also detected in HA, N and St throughout development. Arrowheads point to male LMAN and area X as identified in A–E. For abbreviations, see Table 1. Scale bars = 1 mm.

