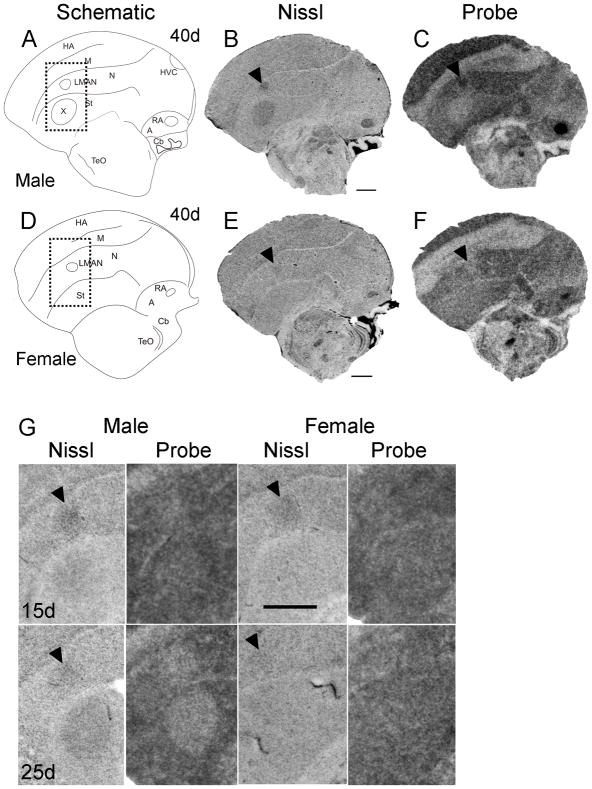
Fig. 9.
Onset of sexual dimorphism in Cntnap2 expression in zebra finch song circuitry. At ~40d Cntnap2 probe hybridization signals in male LMAN and RA (C) were enriched above those in the surrounding pallial regions, which were also robustly labeled. In male area X (B), low Cntnap2 hybridization signal was in contrast to transcript abundance in surrounding St (C). Of note, although transcript was present in this region, Cntnap2 levels were not enriched in male HVC (B) compared to surrounding pallial area (C). Cntnap2 levels did not appear enriched in LMAN (F) of ~40d female and were uniformly distributed in the St which lacks area X (F). Probe signal was enriched in the smaller female RA (F) compared to surrounding A.
At 15 and 25d no sex differences in Cntnap2 expression were detected in LMAN (G). In male song nucleus area X there is indication of downregulation of Cntnap2 transcript at 15d which becomes more apparent at 25d (G). Rectangles outlined with a dotted line in schematic drawings A and D indicate the region of higher magnification Nissl and autoradiography parasagittal images of developing male and female brain depicted in G. Arrowheads in B,C,E,F and G point to male and female LMAN. For abbreviations, see Table 1. Scale bars = 1 mm.

