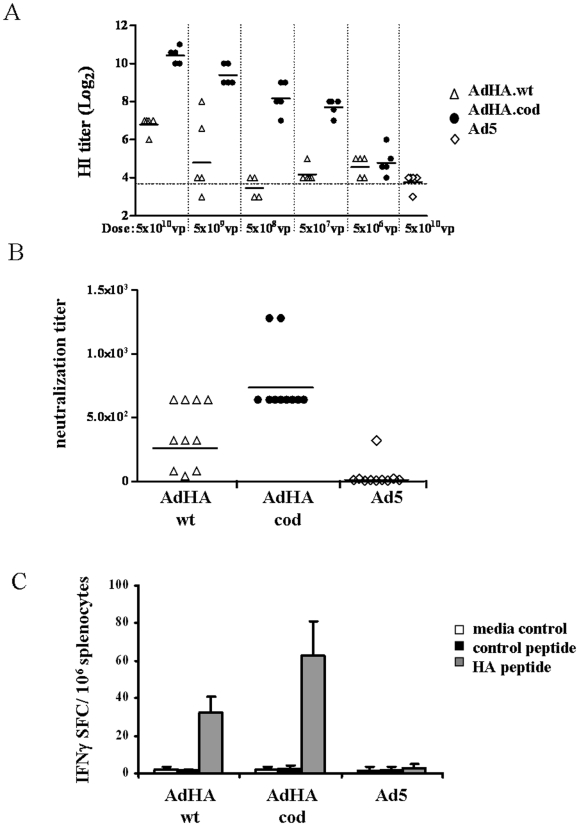
Figure 2. Induction of humoral and cellular immune responses by the H1N1 vaccine candidates.
Induction of influenza H1N1-specific immune responses after subcutaneous immunization of Balb/c mice with adenovirus encoding wildtype (AdHA.wt) or codon-optimized (AdHA.cod) HA antigen or control adenovirus (Ad5). A, Antibody to influenza A/Texas/05/09 (H1N1)pdm in sera of mice after receiving dose escalations of the vaccine candidates (AdHA.wt or AdHA.cod). Shown are log2 values of HI-titer. Horizontal lines represent geometric means in each group. B, Induction of H1N1-specific neutralizing antibodies in sera 5 weeks after immunization with AdHA.wt, AdHA.cod or Ad5 control. Shown are neutralizing antibody titer to influenza A/Texas/05/09 (H1N1)pdm measured by microneutralization assay. Horizontal lines represent geometric means in each group. C, HA peptide specific T cell responses in splenocytes detected in IFNγ Elispot assays. A representative result is shown as means of SFC ± SEM of triplicate determinations in each group.

