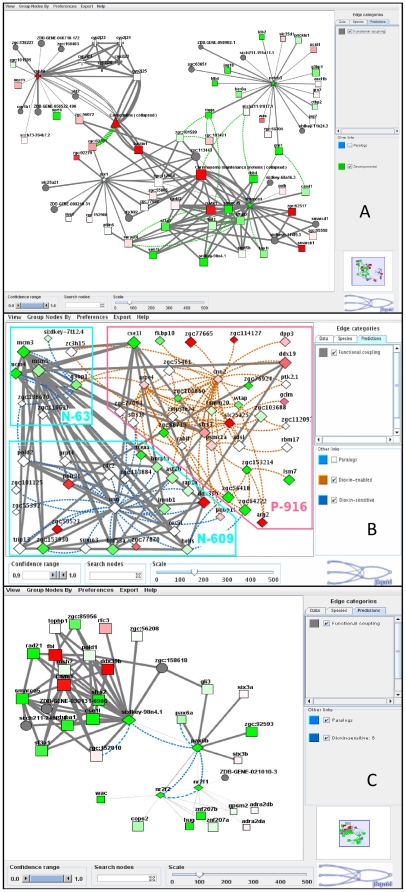
Figure 3. FunCoup sub-networks with genes and links affected by dioxin.
A. Network region around the originally (on day 1) altered CYP1A includes links to gene groups altered later (as discovered with jActiveModules and temporal GO relation analyses): calmodulins (triangles), members of heme biosynthesis (crosses), and neuronal development (stars) pathways. B. Network region with three adjoining clusters enriched in differentially expressed links. cnn2 (calponin 2) is co-expressed with many surrounding genes only after dioxin exposure (cluster P-916), while ung (uracil DNA glycosylase; cluster N-609), on the contrary, is normally co-expressed with its network neighbors but not after dioxin exposure. Meanwhile, several “border” genes lost functional coupling to genes from clusters N-609 and N-63, while gaining coupling to cluster P-916 genes, after dioxin exposure. The clusters are named P-* when containing positive (dioxin-enabled) links, N-* for negative (dioxin-sensitive), or PN-* for both positive and negative links. C. Members of cluster N-632 include DNA/RNA processing, cell division, and embryonic forebrain patterning genes. Interactions: Grey, FunCoup links at confidence FBS>9 (Fig. B) and FBS>3 (elsewhere) (every blue and brown link must overlap with a FunCoup link at FBS>3). For every sub-network, only a sub-set of links was retrieved, filtering for confidence and relevance to query genes with algorithm (1) (see description at http://funcoup.sbc.su.se/algo.html#noislets). Brown, clustered (co-expression + FunCoup) links caused by dioxin treatment; Blue, clustered (co-expression + FunCoup) links disabled by dioxin treatment; Green, developmental-stage specific co-expression. Color lines at A indicate data types evident of functional coupling and are explained in right panel of the screenshot. Nodes: Diamonds: members of respective clusters (i.e., genes participating in a DEL). Squares: other genes with measured expression in the course of the experiment; Circles: other genes having evidence from orthologs in FunCoup but for which expression data was lacking in our experiment. Shades of red and green, up- and down-regulation (main factor “DIOXIN TREATMENT”) with dioxin, respectively; genes missing microarray data colored grey. All modules can be found and manipulated at http://funcoup.sbc.su.se/zfish_supplementary.html, and GO enrichment analysis of modules significantly enriched in at least one GO biological process are presented in Data File S5. Both clusters and individual genes can be accessed at http://funcoup.sbc.su.se/zfish.html. See Methods S1 for details of link inference and other analysis.

