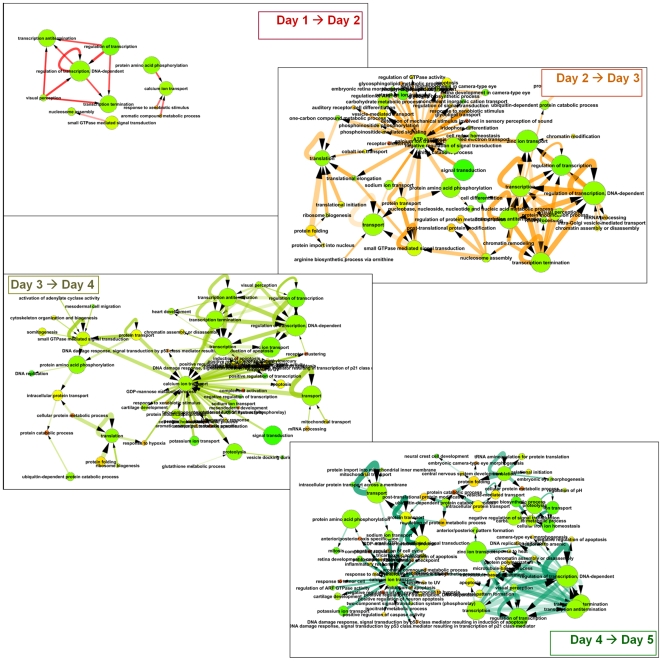
Figure 4. Network of biological processes based on genes dioxin-altered on sequential days.
Nodes of the network are defined as GO “biological process” categories that include one or more differentially expressed genes in the course of the experiment. Thus if a GO category is enriched on day 1 in differentially expressed genes, and linked by an unexpectedly high number of FunCoup interactions to a second GO category that on day 2 is enriched in differentially expressed genes, we infer that this temporal relationship is indicative of causality. Network interactions (edges) represent the sum of interactions between the gene members of the two connected GO categories. Node color represents the fraction of the genes in that node that are regulated by dioxin on any day (green is low, red is high). Edge thickness and opacity represent the number of gene-gene links between two categories and χ2 enrichment score for the likelihood that this pair of categories is enriched in links, respectively. Edge color and arrows show timing of differential expression between gene-gene pairs in respective GO categories.

