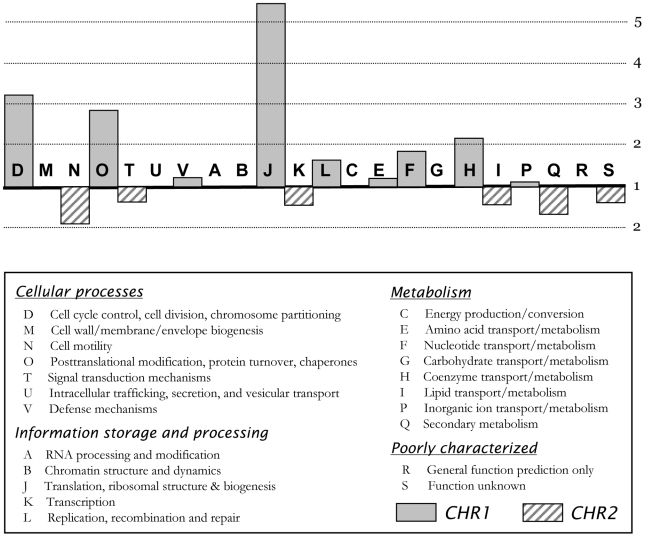
Figure 2. Functional distribution over CHR1 and CHR2 by COG classification.
The scale represents the normalised ratio of CDS numbers per replicon (i.e. the ratio of percentages for each class per replicon); a ration of 1 means that genes classified in a particular COG are, numberwise, evenly distributed over both replicons, taking into account the different total count of genes per replicon. Detailed data are in Table S1.

