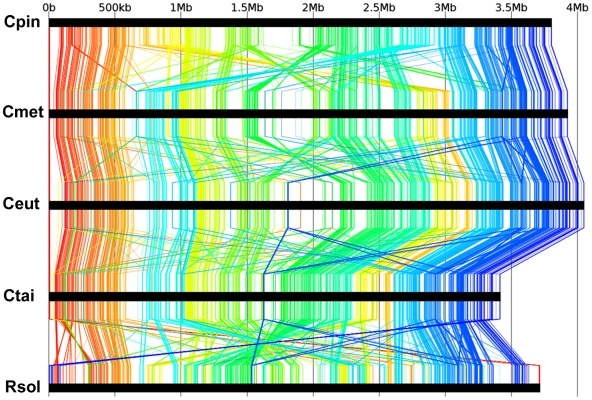
Figure 4. Comparative DNA analysis of Cupriavidus chromosomes.
Nucleotide based comparison of the CHR1 replicons of the four Cupriavidus species (abbreviations as in Figure 3) and R. solanacearum GMI1000 (denoted as Rsol) using the anchor-allignment software Murasaki (http://murasaki.dna.bio.keio.ac.jp/) [218]. Scale in Mb is shown on top.

