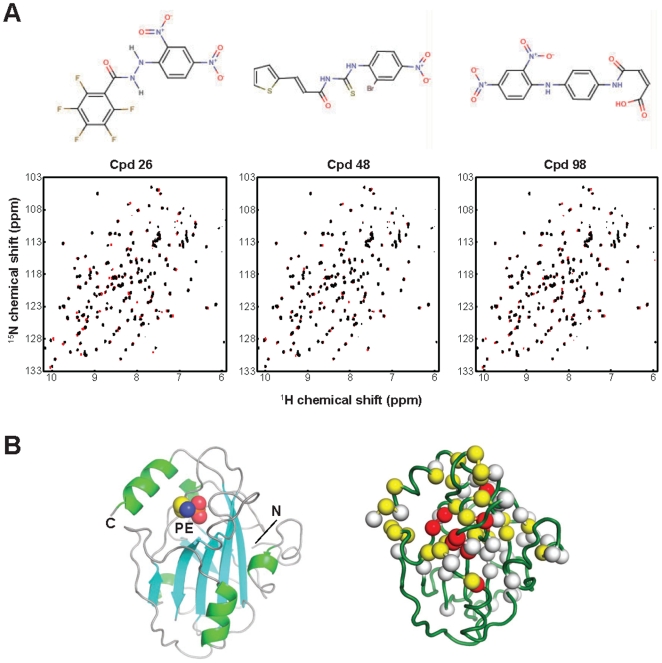
Figure 3. Newly identified RKIP ligands.
(A) The chemical structures of compounds 26, 48 and 98 and their effects on the RKIP HSQC NMR spectrum. The 1H,15N HSQC spectrum of RKIP taken in the presence of the indicated compound is plotted in red and a control spectrum in the absence of a compound in black. The black spectrum is plotted over the red one so that red cross peaks are visible only for those that are perturbed by the compound (B) A cartoon representation of the crystal structure of RKIP bound to PE (left; PDB id, 2IQX), and the locations of residues whose HSQC peaks were perturbed by compound 26. Red, yellow and white spheres indicate the Cα positions for residues whose peaks were shifted by more than two peak widths, 1 to 2 peak withs and less than one peak width, respectively. Because the three compounds perturbed very similar sets of residues, only data for compound 26 are shown.

