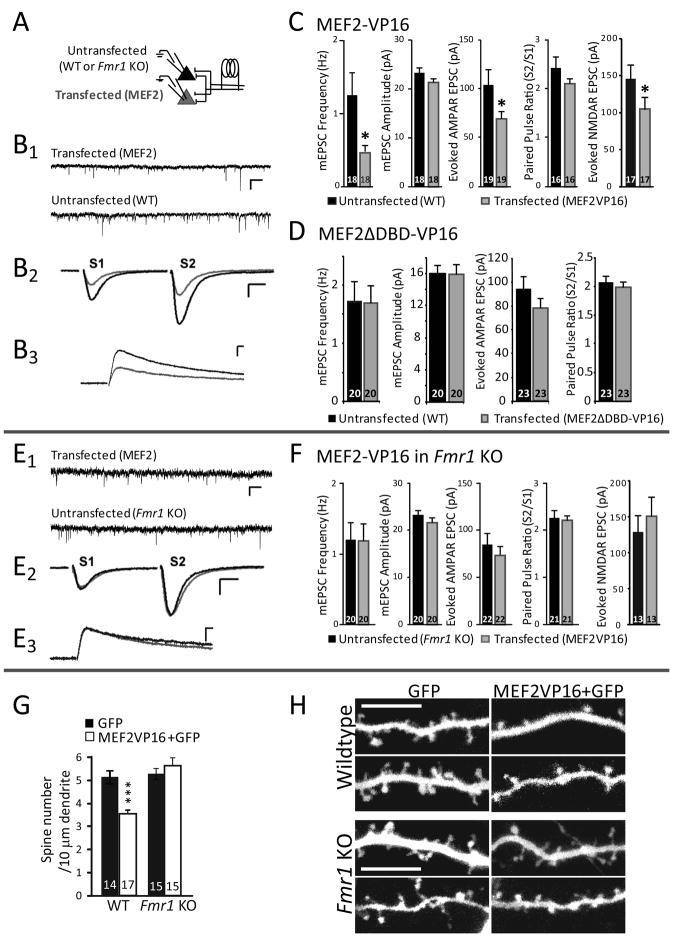
Figure 1. MEF2 activation induces functional and structural synapse elimination in wildtype, but not Fmr1 KO neurons.
A Experimental recording configuration. Organotypic hippocampal slice cultures from p6–7 wild-type (WT) or Fmr1 KO mice were biolistically transfected with MEF2-VP16-ER™ and treated with 4-hydroxytamoxifen (4-OHT) for 24–48 hours to induce MEF2-VP16-ER™ activation. Synaptic function was measured using dual simultaneous whole-cell patch clamp recordings of transfected and neighboring untransfected CA1 neurons. B1,B2, Representative traces of mEPSCs (B1; scale bar = 10 pA/500 ms.) and evoked AMPAR mediated EPSCs (B2; scale bar = 50 pA/10 ms) from a simultaneous recording from an untransfected and a neighboring MEF2-VP16-ER™ transfected WT neuron. B3 Pharmacologically isolated NMDAR mediated EPSCs from untransfected and neighboring MEF2-VP16 transfected WT neurons (scale bar = 50 pA/50 ms). C. Average mEPSC frequency, mEPSC amplitude, evoked AMPAR-mediated EPSC amplitude, and paired-pulse ratio (amplitude EPSC2/EPSC1) from untransfected WT and MEF2-VP16-ER™ transfected cells. Group data of pharmacologically isolated, evoked, NMDAR mediated EPSC amplitudes from untransfected and neighboring MEF2-VP16 transfected WT neurons. In this and all figures, averages are plotted + SEM and n (# of cell pairs) is indicated on each bar. * p< 0.05. D. Transfection of WT slice cultures with MEF2ΔDBD-VP16-ER™, a DNA binding-deficient mutant of MEF2, and treatment with 4OHT does not alter excitatory synaptic transmission. Plotted are average mEPSC frequency, mEPSC amplitude, evoked EPSC amplitude, and paired-pulse ratio from untransfected and MEF2ΔDBD-VP16-ER™ transfected Fmr1 KO neurons. E, F. MEF2-VP16-ER™ transfection into Fmr1 KO slice cultures. E1, E2. Representative traces of mEPSCs (E1; scale bar = 10 pA/500 ms.) and evoked EPSCs (E2; scale bar = 50 pA/10 ms) from a simultaneous recording of an untransfected and neighboring MEF2-VP16-ER™ transfected Fmr1 KO neuron. E3 Pharmacologically isolated NMDAR mediated EPSCs from untransfected and neighboring MEF2-VP16 transfected Fmr1 KO neurons (scale bar = 50 pA/50 ms). F. Plotted are average mEPSC frequency, mEPSC amplitude, evoked AMPAR mediated EPSC amplitude, and paired-pulse ratio from untransfected and MEF2-VP16-ER™ transfected Fmr1 KO neurons. Group data of pharmacologically isolated, evoked, NMDAR mediated EPSC amplitudes from untransfected and neighboring MEF2-VP16 transfected Fmr1 KO neurons., G. MEF2-VP16 reduces average dendritic spine number of wildtype neurons, but not of Fmr1 KO neurons. *** p< 0.001. H. Representative images of apical dendrites from wildtype or Fmr1 KO CA1 pyramidal neurons in slice cultures transfected with GFP alone or MEF2-VP16 + GFP for 36 hours. Scale bar = 10 μm.

