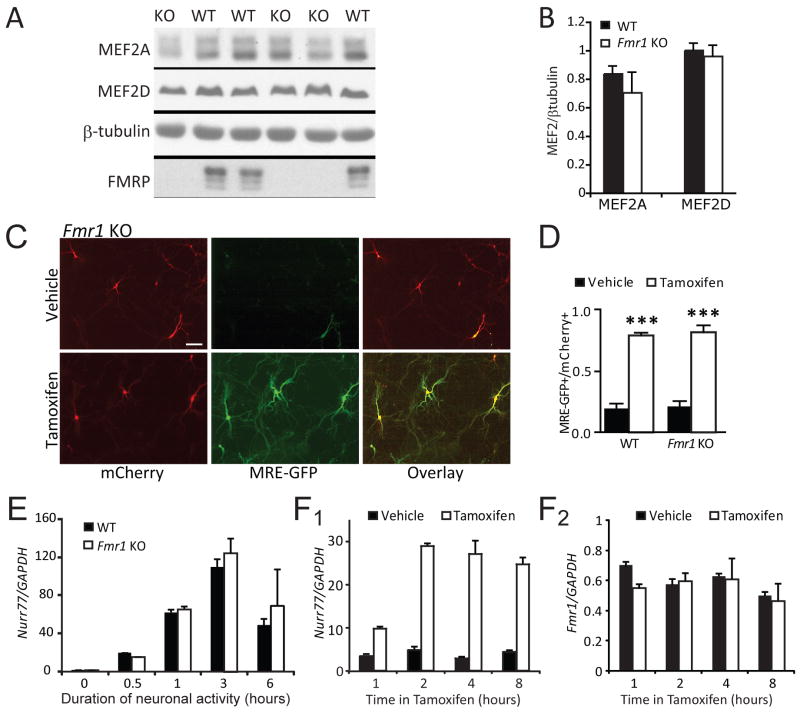
Figure 3. MEF2 levels and MEF2-induced transcription are normal in Fmr1 KO hippocampal neurons.
A Hippocampal lysates from WT and Fmr1 KO littermates (P12–14) were probed for the major MEF2 isoforms, MEF2A and MEF2D. B. Quantification of MEF2A and MEF2D levels (normalized to β-tubulin) WT and Fmr1 KO hippocampi (N = 6 mice from each genotype). C. Dissociated hippocampal neurons (7–8 days in vitro) from WT and Fmr1 KO mice were transfected with MEF2-VP16-ER™, the MEF2 transcriptional reporter, MRE-GFP, and mCherry (transfection indicator), treated 16–24hr with vehicle or 4-OHT, then imaged live. Scale bar = 100 μm. D. Group data of tamoxifen induced MRE-GFP positive WT and Fmr1 KO neurons expressed as a ratio of total number of transfected (mCherry-positive) neurons (mean±SEM; *** p < 0.001). The number of cells per condition >200 for each condition, n = 3 cultures. E. Neuronal depolarization of hippocampal slice cultures from WT and Fmr1 KO was induced for the indicated times with high K+ (55 mM KCl), isotonic media which activates MEF2 mediated transcription (Flavell et al., 2006). Quantitative real time PCR reveals similar activity-dependent induction of the MEF2 transcript Nurr77 in WT and Fmr1 KO cultures (n = 3 cultures (mice) for each time point). F. PC12 cells were transfected with MEF2-VP16-ER™ and treated with tamoxifen for the indicated times. Endogenous mRNA levels of Nurr77 and Fmr1 were determined by quantitative RT_PCR. MEF2 activation of PC12 cells effectively induces Nurr77 transcription (F1), but not Fmr1 (F2), indicating that Fmr1 is not a target gene regulated by MEF2 activation over the 8 hour time period analyzed..

