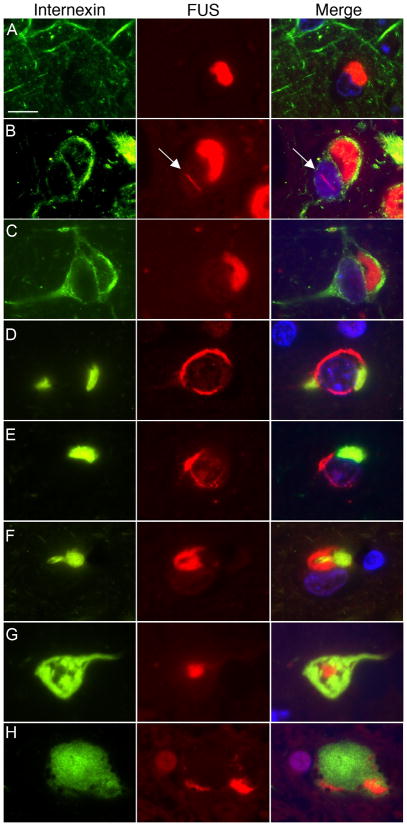
Fig. 4.
Double-label immunofluorescence for α-internexin (green) and FUS (red) in NIFID. Merged images show cell nuclei stained with DAPI (blue). Many neuronal cytoplasmic inclusions (NCIs) only label for FUS (a–c). A subset of neurons with NCI that are only FUS-positive show strong diffuse cytoplasmic staining for α-internexin (b, c). Vermiform neuronal intranuclear inclusions (arrow) only label for FUS (b). Neurons with compact α-internexin-positive inclusions always show additional FUS pathology (d–h). However, note that each marker labels separate components of the inclusions, with only marginal overlap. Hyaline conglomerate inclusions (g, h) are composed mainly of α-internexin but always have at least a small FUS-immunoreactive component, either as a central dot (g), or at the periphery of inclusion (h). Scale bar = 10 μm.

