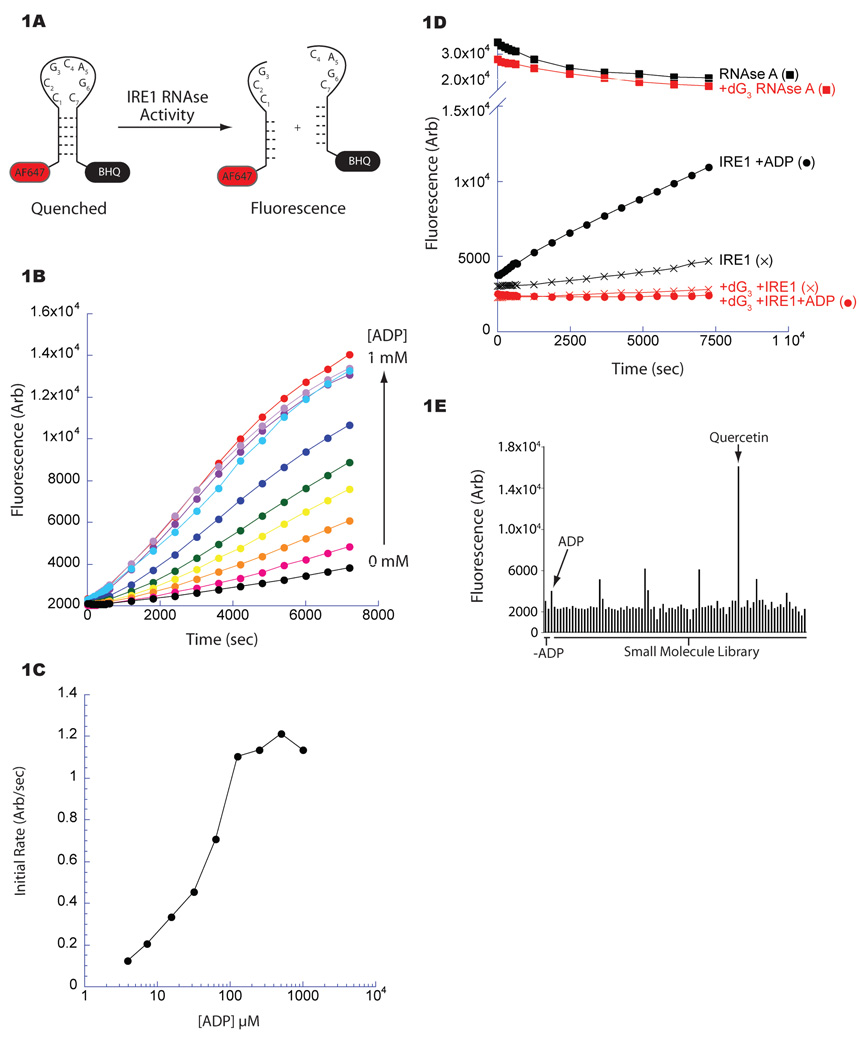
Figure 1. Small molecule screen for modulators of IRE1 RNase activity.
A. Fluorescent-based assay for yeast IRE1 (aa 658–1115) RNase activity. A stem loop RNA substrate incorporating an IRE1 endoribonuclease site (cleavage between G3-C4, labeled bases) was modified 5’ with AlexaFluor 647 (AF647) and 3’ with BlackHoleQuencher3 (BHQ). Cleavage alleviates quenching allowing fluorescence.
B. Fluorescence timecourse measuring IRE1’s RNase. The activity of IRE1 (1.0 µM) incubated with increasing concentrations of ADP was measured by the cleavage of the fluorescent substrate (25 nM) depicted in Figure 1A.
C. Quantification of the ADP-mediated activation of IRE1 RNase shown in Figure 1B. The initial rate of IRE1 RNase activity was plotted against ADP concentration demonstrating an EC50 of ~40 µM.
D. Fluorescence timecourse reporting on cleavage of the IRE1 substrate as in Figure 1A (black) or an altered substrate incorporating deoxyguanosine at position 3 (dG3; red), disrupting cleavage at that site. The maximal signal following cleavage of both substrates was determined by incubation with RNase A (squares).
E. Bar graphs depicting the activity of IRE1’s (1.0 µM) RNase in the presence of various small molecules (25 µM) from a collection of kinase inhibitors after a 10 minute reaction; the wells containing quercetin (25 µM) and ADP (2 mM) are indicated.

