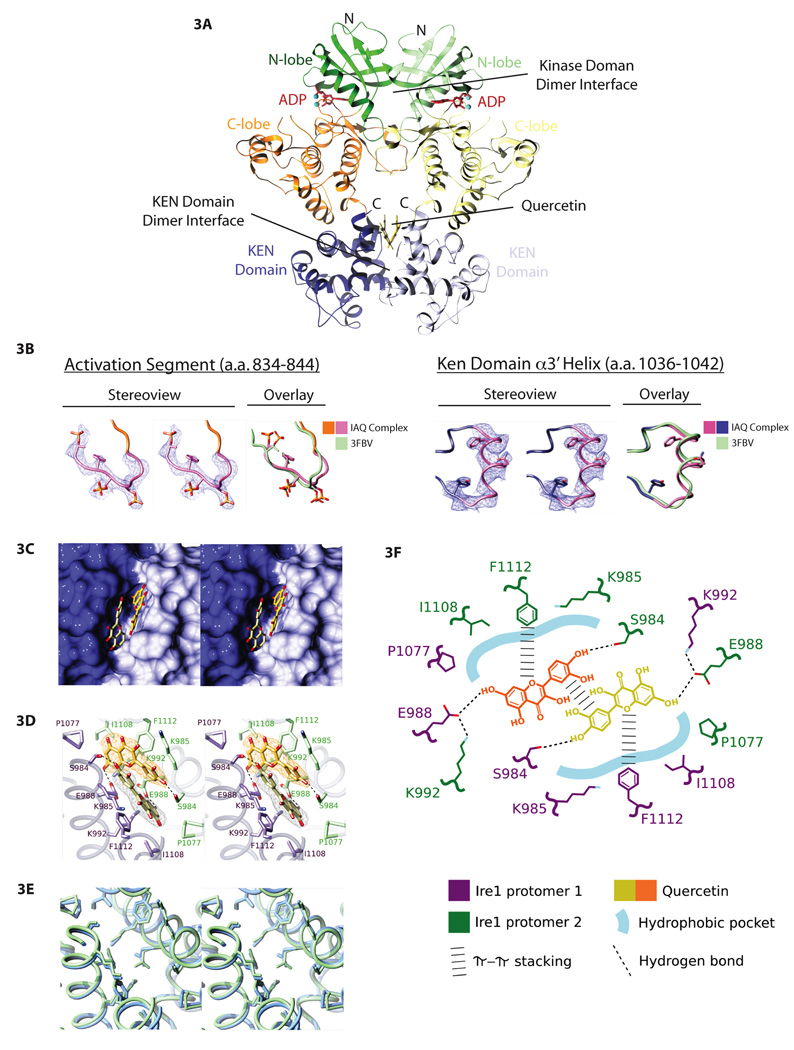
Figure 3. The crystal structure of IRE1–bound by quercetin and ADP reveals a second ligand binding site, the Q-site.
A. Structure of IRE1 (658–1115, Δ869–892) crystallized in the presence of both ADP and quercetin shown in ribbon format (PDB: 3LI0). The kinase domain N- and C-terminal lobes of each protomer in the dimer are green and orange, respectively, and the KEN domains are blue. The kinase and the KEN domain dimer interfaces are indicated. ADP and quercetin are shown in a ball-and-stick representation.
B. Electron density (blue-wire mesh) and tube representation of regions of the IRE1:ADP:quercetin ternary complex that are unstructured in the IRE1:ADP dimer (PDB: 2RIO) are shown in stereo view (two left panels) and superimposed on the structure of the same segments in PBD: 3FBV. Left – Amino acids 837–844 including phosphorylated residues S840, S841, and T844 in the activation segment of IRE1 are shown with side chains displayed in a ball and stick format. Right – Amino acids 1036–1042 from the α3’ helix of the KEN domain are shown with side chain residues in ball and stick format. Both structured regions show significant overlap with the previous crystal structure of oligomeric IRE1 (PDB – 3FBV).
C. Stereo view of the two-fold symmetric quercetin binding pocket (Q-site). The solvent accessible surface of the KEN domain is shown in light blue and dark blue for the two protomers. Quercetin is shown in a ball-and-stick representation.
D. Structure of the Q-site with the residues from the two protomers (purple and green) that interact with quercetin (shown as ball-and-stick in the same view as Figure 3E). Unbiased sigma A-weighted Fo-Fc electron density (see Supplementary Figure 3 for details) for each quercetin molecule is shown as orange or gray wire-mesh.
E. A comparison of the Q-site from IRE1:ADP:quercetin (PDB: 3LI0, blue) and IRE1:ADP (PDB: 2RIO, green) shown in a stereo view and depicted as tubes. The residues that line this pocket are shown in ball-and-stick format (the quercetin ligand has been removed from the IRE1:ADP:quercetin structure).
F. Schematic depicting the spatial arrangement and interactions of IRE1 and quercetin that define quercetin binding to the Q-site.
(also see Supplemental Table 1 and Supplemental Figure 2.)

