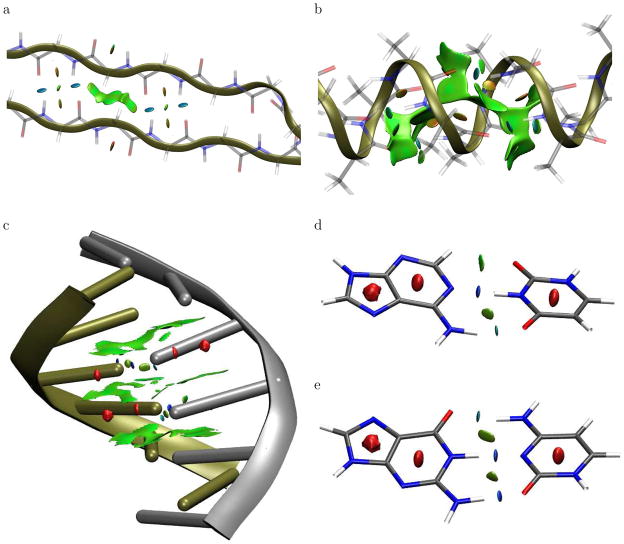
Figure 4.
Gradient isosurfaces (spro = 0.35) for cuboid sections of the (a) β-sheet and (b) α-helix polypeptides. Gradient isosurfaces (spro = 0.25) are also shown for the (c) B-form of DNA, and the (d) A-T and (e) C-G base pairs. The surfaces are colored on a blue-green-red scale according to values of sign(λ2) ρ, ranging from −0.06 to 0.05 au. Blue indicates strong attractive interactions and red indicates strong non-bonded overlap.

