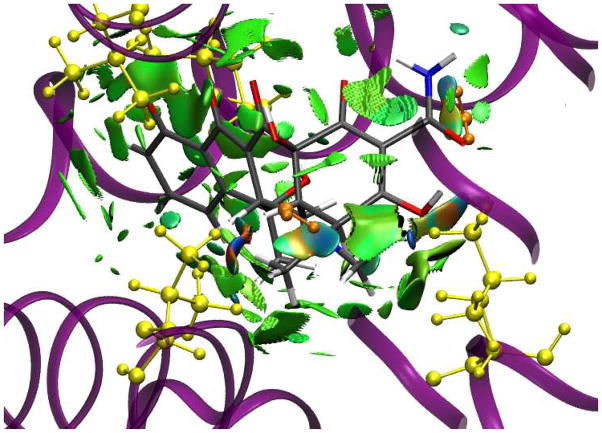
Figure 5.
Gradient isosurfaces (spro = 0.35) for interaction between the tetR protein and tetracy-cline inhibitor. The surfaces are colored on a blue-green-red scale according to values of sign(λ2)ρ, ranging from −0.06 to 0.05 au. Blue indicates strong attractive interactions and red indicates strong non-bonded overlap.

