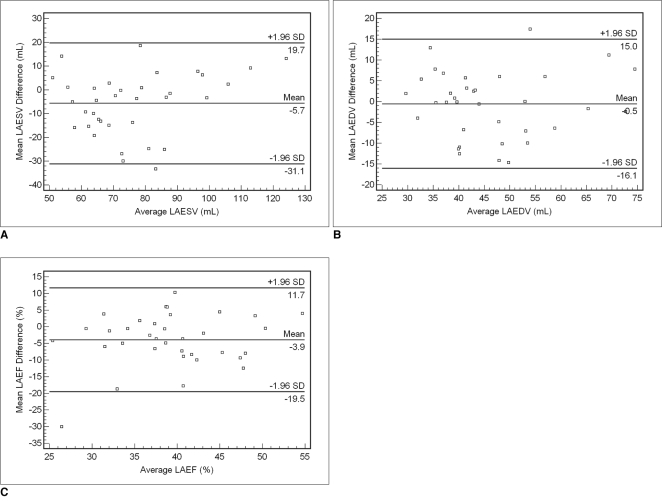
Fig. 4.
Bland-Altman plots for determining left atrial volumes and function between two measurement methods of cardiac multidetector CT.
A-C. Plots show relationships between 2D length-based method (2D LBM) and 3D volumetric threshold-based method (3D VTBM) of cardiac multidetector CT for measurement of left atrial end-systolic volume (A), left atrial end-diastolic volume (B), and left atrial ejection fraction (C). Mean differences (y-axes) between each pair ([mean 2D LBM] - [mean 3D VTBM]) are plotted against average values (x-axes) of same pair ([{mean 2D LBM} + {mean 3D VTBM}]/2). The mean differences between the two measurement methods by cardiac multidetector CT were significant for left atrial end-systolic volume and left atrial ejection fraction (p < 0.05), but not for left atrial end-diastolic volume (p > 0.05). LAESV = left atrial end-systolic volume, LAEDV = left atrial end-diastolic volume, LAEF = left atrial ejection fraction

