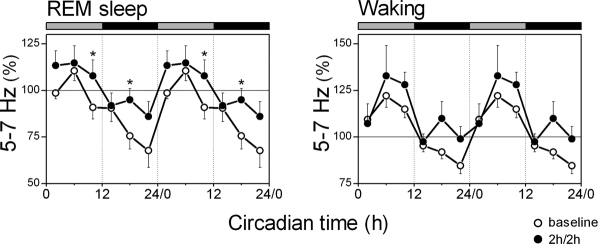
Figure 6.
Theta activity (5-7 Hz) in REM sleep and waking. Data are plotted as percentage of the mean activity of the corresponding frequency during the baseline 24-h. The curves connect 2-h mean values (n = 8) for the 24 h of the 2h/2h protocol (dots) and corresponding baseline intervals (circles). Data are double plotted to visualize the daily rhythm. Rest onset (CT 0) was determined per individual animal. The horizontal bars on a top indicate the rest (grey) and active (black) phase. Significant differences between the 2h/2h protocol and corresponding intervals of baseline are indicated by *(P < 0.05), 2-tailed paired t-test after significant rANOVA, factor “day.”

