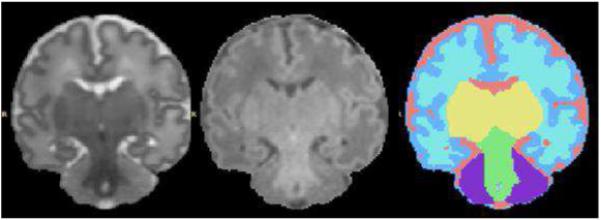
Fig 4.

Image segmentation for quantitative volumetric analysis. The image on the left is a coronal T2-weighted image. The image in the center is the corresponding T1-weighted image. The image on the right is the segmentation map derived from these MR images. In this segmentation map components of the brain can be identified as follows: CSF (pink), unmyelinated white matter (taupe), cortical grey matter (blue), basal ganglia (yellow), myelinated white matter (green), and cerebellum (purple).
