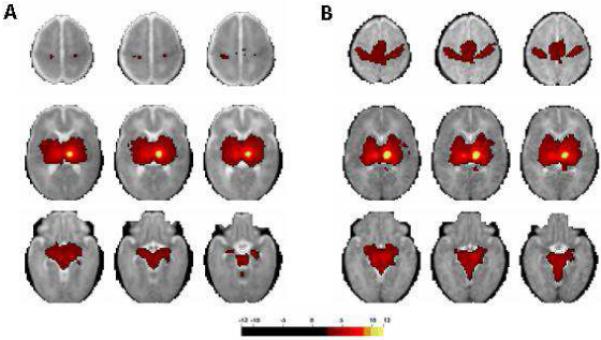
Fig 7.

fcMRI maps generated using thalamic seed. The images on the left (A) are the average of 28 preterm infants with minimal injury on conventional MRI who underwent fcMRI at term equivalent PMA. The images on the right (B) are the average of 10 term control infants who underwent fcMRI during the first week of life. The colored areas represent regions in which a significant correlation was found between spontaneous fluctuations of the local BOLD signal and those of the thalamic seed. Note the marked difference in thalamo-cortical connectivity between these two data sets. (Images provided courtesy of Dr. Chris Smyser)
