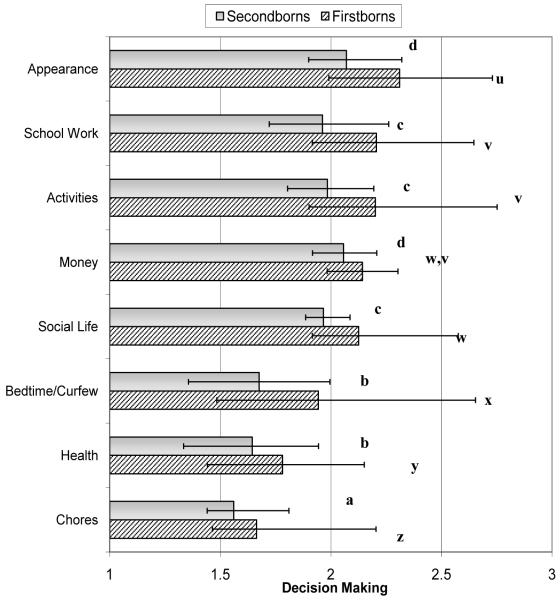
Figure 2.
Across-time decision-making item means for firstborn and secondborns.
Note. Means represent averages pooled across 7 occasions. Bars represent range of change over time for each item. Secondborn differences (shaded bars) of p < .05 are denoted by a, b, c, d, and e. Firstborn differences (striped bars) of p < .001 are denoted by u, v, w, x. y, and z.

