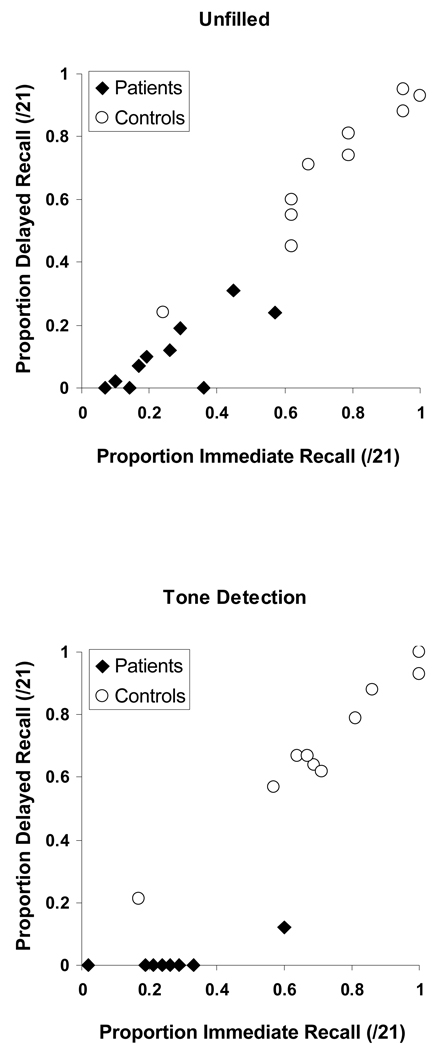
Figure 3.
Individual mean proportion delayed recall as a function of individual mean proportion immediate recall, in patients and control participants (graph parameter). Both recall measures shown here are absolute proportions of the 21 story ideas presented. Top panel, tone detection condition; bottom panel, unfilled condition.

