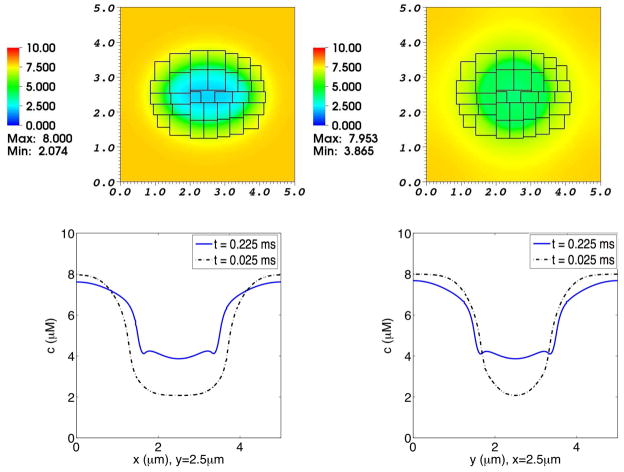
Fig. 10. Concentration distribution of Cl− in a simulation of the advection-electrodiffusion of two ionic species interacting with a moving elastic membrane.
The upper panels show the Cl− concentration distribution on the composite grid at time t = 0.025 ms (left) and at t = 0.225 ms (right). The lower panels show Cl− concentration profiles through the center of the domain. In each of these lower panels, the dotted curve shows the concentration profile at t = 0.025 ms, and the solid curve shows the concentration profile at t = 0.225 ms. In the lower left panel the concentrations at the two times are plotted as functions of x for fixed y, and in the lower right panel they are plotted as functions of y for fixed x. As the elliptical membrane becomes more circular, the concentration profiles shift accordingly. Even though the membrane is freely permeable to Cl−, the interior and exterior Cl− concentrations do not equalize because of the transmembrane electrical potential that develops as Cl− diffuses inward but Ca2+ is for the most part prevented by a chemical potential barrier from crossing the membrane.

