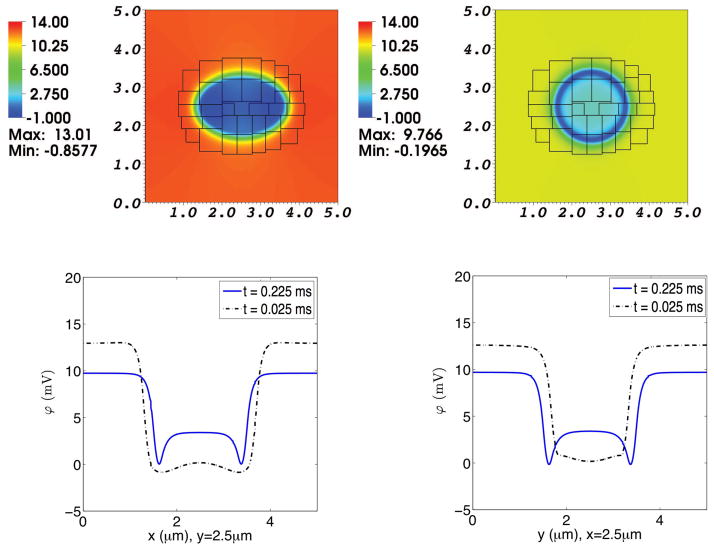
Fig. 12. Electrical potential in a simulation of the advection-electrodiffusion of two ionic species interacting with a moving elastic membrane.
The upper panels show the electrical potential on the composite grid at time t = 0.025 ms (left) and at t = 0.225 ms (right). The lower panels show electrical potential profiles through the center of the domain. In each of these lower panels, the dotted curve shows the electrical potential profile at t = 0.025 ms, and the solid curve shows the electrical potential profile at t = 0.225 ms. In the lower left panel the potentials at the two times are plotted as functions of x for fixed y, and in the lower right panel they are plotted as functions of y for fixed x. As the elliptical membrane becomes more circular, the electrical potential profiles shift accordingly. Notice, too, the development of local minima of potential just inside the membrane. This is related to the triphasic distribution of space charge across the membrane, as shown in the previous figure, which may in turn be a transient effect associated with the nonzero permeability of the membrane to Ca2+.

