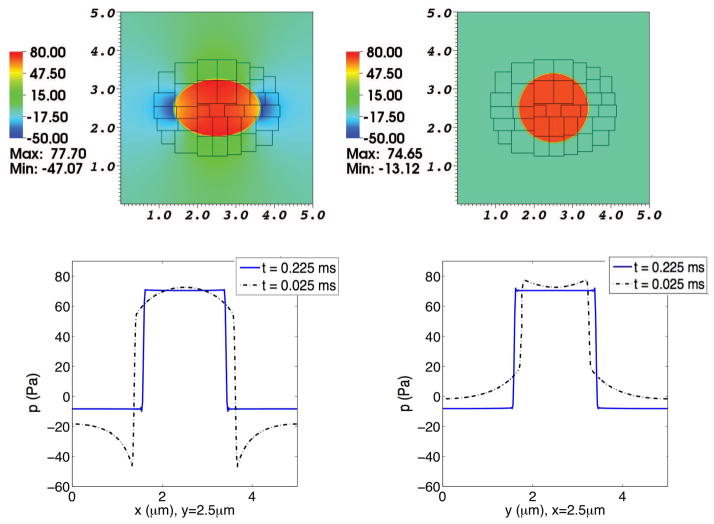
Fig. 13. Pressure in a simulation of the advection-electrodiffusion of two ionic species interacting with a moving elastic membrane.
The upper panels show the pressure on the composite grid at time t = 0.025 ms (left) and at t = 0.225 ms (right). The lower panels show pressure profiles through the center of the domain. In each of these lower panels, the dotted curve shows the pressure profile at t = 0.025 ms, and the solid curve shows the pressure profile at t = 0.225 ms. In the lower left panel the pressures at the two times are plotted as functions of x for fixed y, and in the lower right panel they are plotted as functions of y for fixed x. As the elliptical membrane becomes more circular, the pressure profiles shift accordingly. Besides the pressure jump across the membrane, which is present both early and late in the simulation, there are pressure gradients at the earlier time (broken curves) throughout the moving fluid. These pressure gradients disappear as the membrane settles into its circular equilibrium configuration and the pressure profiles become essentially piecewise constant (solid curves).

