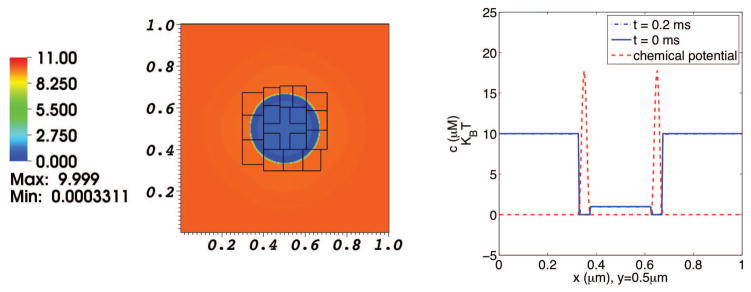
Fig. 2. Concentration distribution in a simulation of the diffusion of one solute species interacting with a membrane at rest.
The left panel shows the solute concentration distribution on the composite grid at t = 0.2 ms. The right panel shows graphs of solute concentration (blue) and chemical potential (red) along the line y = 0.5 μm, which cuts through the center of the domain. The dotted blue curve depicts the initial solute concentration, and the solid blue curve depicts the solute concentration at t = 0.2 ms. Since the chemical potential barrier is high in comparison to KBT, there is little movement of solute.

