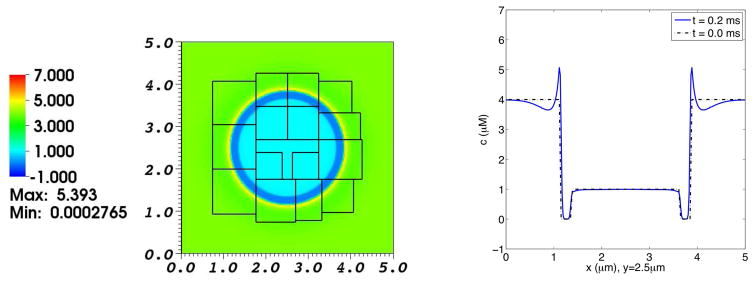
Fig. 5. Concentration distribution of Ca2+ in a simulation of the electrodiffusion of two ionic species interacting with a membrane at rest.
The left panel shows the Ca2+ distribution on the composite grid at t = 0.2 ms. The right panel is a graph of the Ca2+ concentration profile as a function of x along the line y = 2.5 μm, which goes through the center of the domain. The broken curve shows the initial Ca2+ concentration profile for reference, and the solid curve shows the Ca2+ concentration profile at t = 0.2 ms. At the initial time, the concentration of Ca2+ in the interior and exterior regions are 1.0 μM and 4.0 μM, respectively. Note the excess concentration of calcium ions near the outer side of the membrane at time t = 0.2 ms. There is a high chemical potential barrier to the diffusion of Ca2+ across the membrane, but the membrane is freely permeable to Cl− in this simulation.

