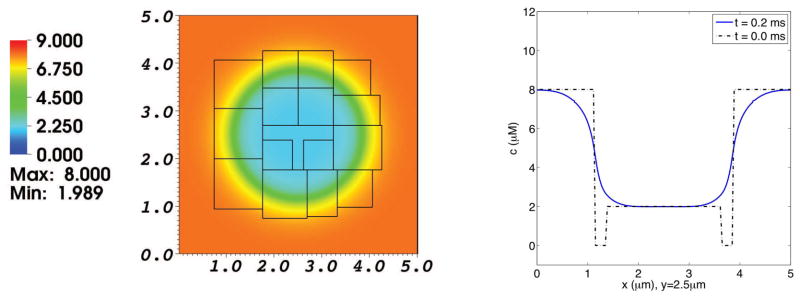
Fig. 6. Concentration distribution of Cl− in a simulation of the electrodiffusion of two ionic species interacting with a membrane at rest.
The left panel shows the Cl− distribution on the composite grid at t = 0.2 ms. The right panel is a graph of the Cl− concentration profile as a function of x along the line y = 2.5 μm, which goes through the center of the domain. The broken curve shows the initial Cl− concentration profile for reference, and the solid curve shows the Cl− concentration profile at t = 0.2 ms. At the initial time, the concentration of Cl− in the interior and exterior regions are 2.0 μM and 8.0 μM, respectively. The membrane is almost impermeable to Ca2+, but freely permeable to Cl−. Only enough Cl− crosses the membrane to set up space charge layers that generate an electrical potential difference across the membrane that is large enough to prevent further transmembrane flux of Cl−.

