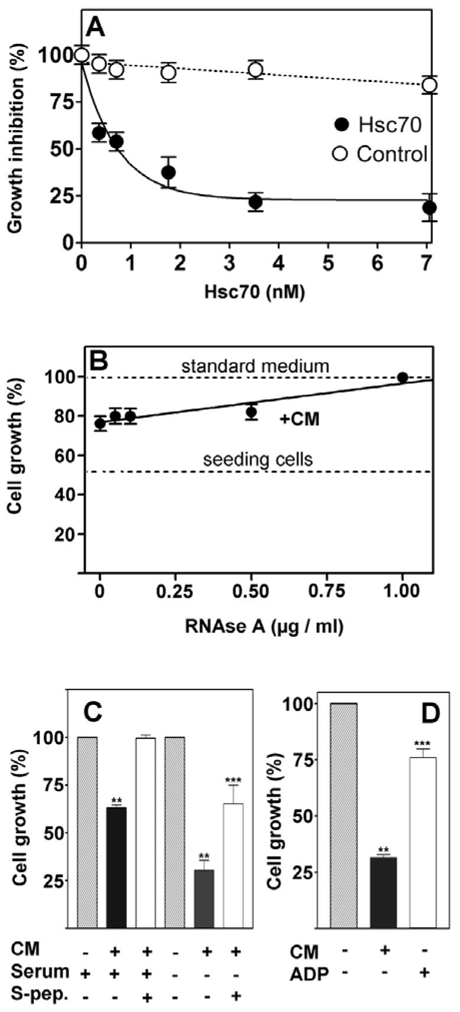
Figure 6. Effect of purified Hsc70 and Hsc70 competitors on cell growth.

(A) Increasing amounts of Hsc70 purified from confluent control cells as described in Figure 2C were added to recipient exponential cell cultures. Cell growth was monitored by their DNA content after 5 days treatment (filled circles). Identical volumes of ATP-eluted fraction that did not contain hsc70 was used as control (open circles). (B) Increasing amounts of RNAse A were added to the control cell conditioned medium (CM) at the indicated concentration. Cell growth was the result of the cellular DNA content determined by DABA assay. Dashed lines represent the seeding cells at the beginning of the experiment, and the cell growth in standard medium with 2% serum (without CM). The data are mean results of three independent experiments run in triplicate. (C) 1 μg/ml S-peptide was added to the culture medium with 5% (+) or with 0.5% (−) serum. Cell growth was measured as previously mentioned. (D) Cell growth was inhibited by the control cell CM and this effect was reversed by an initial batchwise treatment with ADP-agarose (CM+ADP) to remove Hsc70. (** p<0.001 vs untreated control, *** p<0.001 vs CM).
