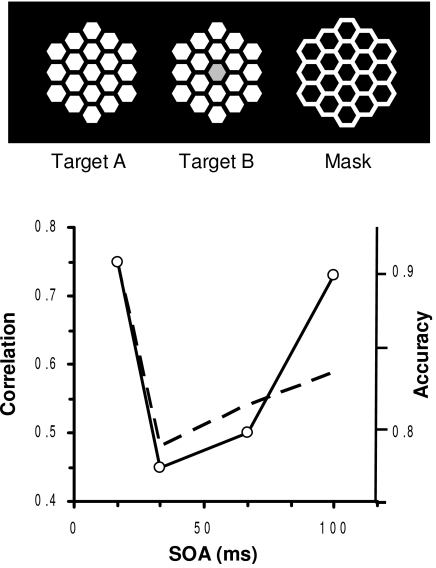
Figure 3.
Upper panel: “Honeycomb” target and mask stimuli. Lower panel: Correlation, derived from the fMRI results of the same observer, between activity in V1 level and the fusiform- gyrus (FG) level of cortical processing as a function of the SOA between the targets and the mask. (From Haynes, Driver & Rees, 2005)

